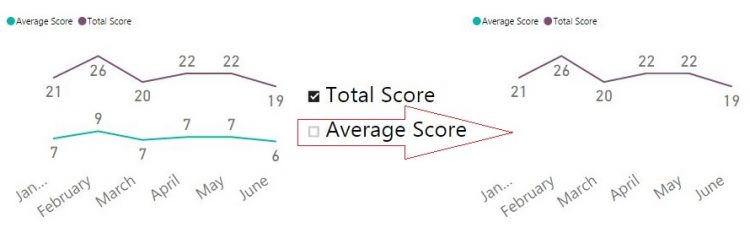
A few days ago a client asked me if it is possible to dynamically change series displayed on Power BI chart. My first (instinctive) answer was “Yes, of course, you can use a slicer to select which series you want to show, just put desired column in a slicer visual”. But then he added details: he wanted to select a measure to display on a chart, not to filter a value from column. My second (instinctive) answer was “No, you can’t. You can only filter a column, and can’t place measures in a slicer”.
But after a little chat I started to wonder whether it is really impossible. If we put a measure in a “Value” well of chart fields, it will be shown as a series (for example, some [Total Amount] measure). What my client is actually wants? He want to choose some elements on the slicer and, if one element selected, to show a measure. If that element is unchecked, then don’t show a measure.
Actually, those slicer’s elements are unique values from some column. A slicer applies a filter to that column. Can we catch whether a column is filtered? Yes, of course, we can do it with DAX. And if some desired value is selected, we just need to show a measure as a series. As that measure is already in the “Value” well of a chart, then, in other words, we just have to “do nothing”. So, we only need to somehow hide a measure if a desired slicer’s element didn’t selected.
Continue Reading →
Follow me: 


The history of “reinventing the bicycle” using DAX
Defining evaluation context and context transition rules is the most important and confusing part of DAX. Sometimes when you think you’ve already managed it, DAX turns to you with other side, hook, uppercut – and you’re knocked down.
Last week one of my Facebook friends asked me to explain why his measures working this way and not that way. It was quite easy questions and there is no sense to place them here. But my friend is a very curious man, one question led to another, and suddenly I found that I can’t explain a very simple, on the first look, concept. The question was about filtering under context transition in calculated column (here you can imagine a very big grin on DAX’s face).
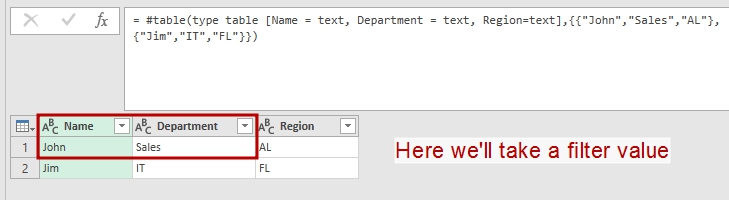
For this post I reworked and simplified data model.
There are two tables, named
‘Managers’ and
‘Sales’ .
‘Managers’ has only two columns:
[Manager] and
[Department] .
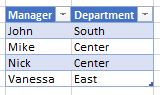
‘Managers’ table
‘Sales’ has a little bit more columns (although it doesn’t matter here):
[Order] ,
[Manager] ,
[Amount] and
[Order type] .
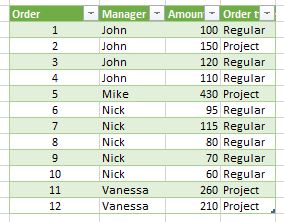
‘Sales’ table
As you can see, they are linked one-to-many by
[Manager] column. Quite easy.
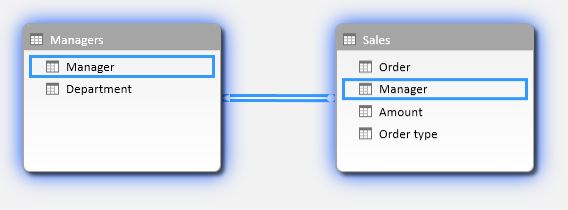
Data Model
First of all my friend asked me, how context transition works. “Hey, it’s easy!” – I said, and Continue Reading →
Follow me:
There are many ways to get a value from parameters table and then pass it to query. One of this methods uses direct selection of unique parameter name. I think it worth a post.
Items selection: brief reminder
As I described in my first ever post “Absolute and Relative References in Power Query”, when we would like to refer to a single item in a list or a cell in a Power Query table, we can use
Name{Argument} syntax:
TableName{Row} or
ListName{Element} . If
Name is a table or list, and
Argument is number, then it is simple: we asking for a row or element of such position.
The most commonly used syntax for single cell addressing in tables is
|
|
Table{RowNumber}[FieldName] |
But it is often omitted that if
Name is a table,
Argument could be not a number but a record:
Quick filter for unique values
Value passed as
Record in this expression works like a filter for a matching field in the table. For example,
[empl_name = “John”] .
How it works and what is in it for practical uses?
If
- our table has a column named
empl_name
and
- row with value “John” in this column could be found,
and
- this row is unique (i.e. there is only one row with value “John” in column
empl_name , matching to the
Record ),
then entire record (i.e. row) will be returned as the result of this expression. In other words, a unique matching record from the table.
But there is one important restriction: if there is no unique matching row in the table, an error is raised.
So, when
Table{Record} returns a desired result, it has type of record and we can reach a single item from this record by referring to desired field in it:
We can see this method in action when we build query to a table from Excel file. Power Query will create such string of code automatically:
|
|
= Excel.CurrentWorkbook(){[Name="Parameters"]}[Content] |
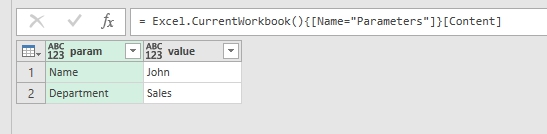
How Power Query refers to a table in Excel workbook
Implications
For example, we would like to implement table for passing user-defined parameters to Power Query (I recommend this great post “Building a Parameter Table” by Ken Puls):
|
|
myTable = #table(type table [param = text, value = text],{{"Name","John"},{"Department","Sales"}}), person = myTable{[param = "Name"]}[value], dept = myTable{[param = "Department"]}[value] |
In this example in the first row we create a parameters table with columns param and value that is supposed to be a parameters table for use in other queries.
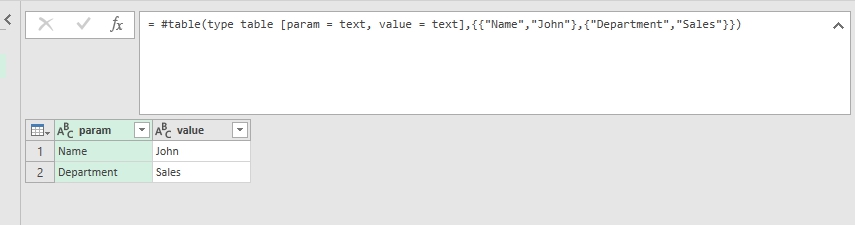
Hardcoded parameters table (just for sample)
Then we got a parameter’s value by applying “record filter” and selecting desired field (
[value]):
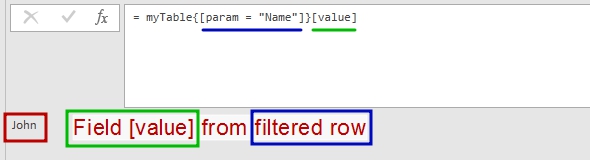
Now we can quickly get “Name” parameter’ value from the table above
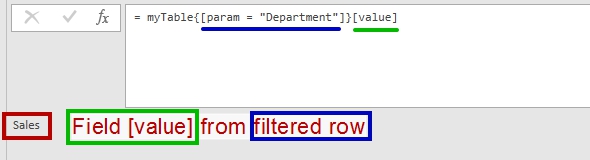
And “Department” parameter’ value from the table above. Any unique parameter.
What are the benefits in this approach?
- First of all, we do not need to remember a desired parameter row when coding (what if user swapped rows in parameters table?).
- Then, we do not need to filter parameters table each time to get a desired value.
- And also we can check for parameters table integrity – if there will be several rows with the same parameter name, or missing parameter value, or missing field, then we’ll got an error and can handle it.
And, don’t forget that this
Table{Record} method has a lot of other uses – when we really need to get a record as a result of expression. Also we can pass a more complex (with 2 or more fields) record as filter.
And
Argument record could be a result from other queries. Lets name this query as “QueryRecord”:
|
|
let Source = #table(type table [Name = text, Department = text, Region=text],{{"John","Sales","AL"},{"Jim","IT","FL"}}), QueriedRecord = Record.RemoveFields(Source{0},{"Region"}) in QueriedRecord |
We’ll take a record from this table
The result of above query is a record with two fields:
[Name = "John", Department = "Sales"] .
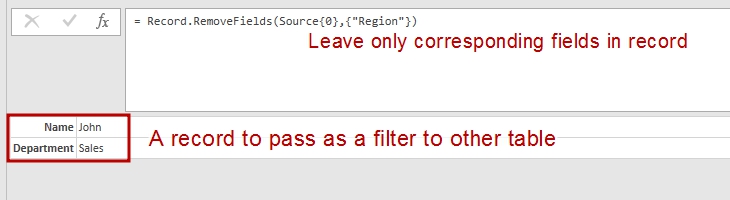
I leaved only needed fileds in this record
Then we pass it as an filter argument to other table:
|
|
let Source = #table(type table [Name = text, Department = text, Date = text],{{"John","Sales","01.01.16"},{"Jim","IT","02.01.16"}}), ChType = Table.TransformColumnTypes(Source,{{"Date", type date}}), Filtered = try ChType{QueryRecord} otherwise null in Filtered |
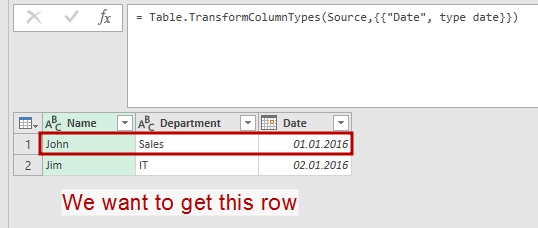
We will filter this table with the result of previous query
The result is a desired record:
|
|
[Name = "John", Department = "Sales", Date = "01.01.2016"] |
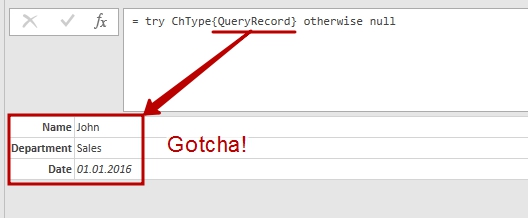
Hey-ho, it works!!!
Another one “Get parameter” function
And a cherry on the cake – quick parameter selection function. You can easy change it for your needs:
|
|
(param_table as table, param_name as text) => let fnParam = try param_table{[param=param_name]}[value] otherwise null in fnParam |
You can also find a complete description of item selection in “Microsoft Power Query for Excel Formula Language Specification” (see “6.4.1 Item Access” on page 59 in August 2015 edition).
Follow me:
In my mind List.Accumulate is one of most undocumented and most underestimated functions in Power Query ‘M’ language. In this post I would like to continue explanation of this very interesting iterative function.
Data types
In my previous post about List.Accumulate function in Power Query ‘M’ language I’ve mentioned that seed value, passed to function, could be any. As it was described in Gil Raviv post,
The seed argument (or as we call it the initial state), should be of the same type as the first argument of your accumulator function and of the same type as of the function’s output.
Now I want to add more details to an explanation of the List.Accumulate arguments’ behavior:
- We can pass a seed value of any allowed in Power Query data type to function. What we can pass as a seed: table, list, number, date, record, null, duration… anything.
- Actually (and here I’d like to correct Gil) function’s output type is independent from the seed type.
- Function output type depends only from data type returned by accumulator sub–function. Real output type could be any:
|
|
List.Accumulate({1,2,3},0,(state, current)=>(if state = 0 then "" else Text.From(state))&Text.From(current)) // equals “123” |
- The first (state) argument in accumulator sub-function has to be the same type as seed value only at first iteration and only if state argument is used in accumulator (I really see no sense in manipulations without using state argument, but you can do it, that’s why I noted it). After the first iteration the accumulator result will totally depend on what this sub-function does (as shown above).
- The list elements could be used in accumulator sub-function. Could be not. You can use the list only as iteration counter – accumulator will perform its manipulations as many times as the count of list elements. This means that you can use List.Accumulate as “For Each … Next” loop (which has as many steps as a count of elements in list).
Let us try to look at how those features could be implemented.
SUMPRODUCT () in Power Query
For a starter let’s try to convert the famous Excel function, SUMPRODUCT, to Power Query function.
Why we really need it?
There are a lot of ways to implement SUMPRODUCT in Power Query. For example, we can add custom column with formula like this: = [Amount] * [Price] and then just get the sum of it. It’s easy and clear, except we need to add this helper column to get just one number.
But let suppose we have got two lists by some query manipulations and these lists are not columns in any table. We can transform them to tables, and then somehow combine those tables, perhaps with Index column, and… looks not as easy as it was with columns in one table?
SUMPRODUCT itself
With List.Accumulate we can do it with just one row of code:
|
|
let myList1 = {1,1,2,2,4,5}, myList2 = {1,4,2,2,1,5}, SUMPRODUCT = List.Accumulate(MyList1, [Sum=0, Index=0], (state, current) => [Sum = current * MyList2{state[Index]}+state[Sum], Index = state[Index]+1])[Sum] in SUMPRODUCT |
Obviously it equals 42.
How it works
- Here we got two lists of the same size, MyList1 and MyList2
- We’ll use one of lists as an list argument of List.Accumulate. We actually will use its elements in calculation, but also the count of list elements will be used as a counter to iterations inside our function.
- As the seed argument we used a record: [Sum=0, Index =0], where Sum will be used as field for calculation and Index will be used as list’s current position counter.
- We can describe the accumulator function as follows:
- For Each current element In MyList1
- Multiply current on MyList2{state[Index]} (where state[Index] is the value of Index from previous step or from seed if it is first step)
- Add the result to the state[Sum] (where state[Sum] is the previous/seed value of Sum)
- Increase previous/seed value of Index by 1
- Next
- At the end of the loop we have the result as a record of two fields: Sum and Index, as a result of Accumulate. We need only Sum field value, so we just add this filed name in square brackets at the end of row to get its value. Actually it means “give me the value of the [Sum] field from List.Accumulate result”.
SUMPRODUCT() UDF for PowerQuery/’M’
You can easily transform code from above to the one-row function for future uses:
|
|
(MyList1 as list, MyList2 as list) as number => let SUMPRODUCT = List.Accumulate(MyList1, [Sum=0, Index=0], (state, current) => [Sum = current * MyList2{state[Index]} + state[Sum], Index = state[Index] + 1])[Sum] in SUMPRODUCT |
Of course, you can enhance it with error handling and other feautures, as you want.
Enjoy! 🙂
(to be continued)
Follow me:
After @datachant have posted on using List.Accumulate in Power Query, I was intrigued of practical implementations of this function.
As you can see from his post, List.Accumulate takes a list as an input parameter, and then, starting from initial seed value, invokes the same accumulator function on each element of list, consequently.
You just need to remember than List.Accumulate can use two parameters in accumulator function, state and current: state (i.e. current result of previous calculations) of accumulator and a current element from given list. Final result will be a value that we got on the last iteration of accumulator function. Please note that seed value actually used as the first state value in accumulator.
The power of List.Accumulate is in iterations: we will execute accumulator function as many times as the number of elements in list. So, if we have an algorithm that needed repeating calculations on list members or as much times as list members count, List.Accumulate is the answer.
I found a small algorithm that shows a practical use and core concepts of List.Accumulate: conversion from binary number to decimal. In this algorithm bits of the binary number are used one by one, starting with the most significant (leftmost) bit. Beginning with the value 0, you need to repeatedly double the prior value and add the next bit to produce the next value.
So, if we would like to convert binary 11012 to decimal number 1310, we need to split binary number to the list of bits:
{1,1,0,1}
Then we take seed value of 0 and perform next operations: double the prior value and add the next bit, repeat while we have bits:
0 (seed, or first state) *2 + 1(current bit) = 1
1 (state) * 2 + 1(current bit) = 3
3(state) * 2 + 0(current bit) = 6
6(state) * 2 + 1(current bit) = 13
In this algorithm we can see all parameters for List.Accumulate: given list of bits from binary code, initial seed value of 0, state of accumulation transferred from the one step to the next step, and current element of a list (current bit).
To implement this algorithm in Power Query List.Accumulate we just need to get a list from given input, for example it is a text string: “101010”
|
|
BitList = Text.ToList("101010") // here we’ll get a list of text symbols, // so at the next step we need to implement type transformation // on list elements to be able to do calculations Bin2Dec = List.Accumulate(BitList, 0, (state, current)=> state*2 + Number.From(current)) |
The result could be nothing than 42, it’s quite universal 🙂
I hope that this example will help you to find more practical implementations of List.Accumulate. And if you remember that initial list could be used just as iterations counter, and a seed value could be any… to be continued.
Follow me:
There are plenty examples on how to unpivot nested tables (some brilliant ones can be found here and here). But what if a table we need to make flat has no nested headers for repeating groups of columns? It ought to be nested, but it doesn’t. And standard unpivoting methods then do not works then.
Stacking (or unpivoting) non-nested groups of columns is not a common task, but sometimes it appears. It could be due to bad constructed software report or hand-made user table in Excel or web-page scrapping. But in some case, we meet with this horror.
Once a client asked me to help with intelligence on his database. Of course, I agreed. But when I saw this “database” which he proudly presented to me, I was glad that the customer does not see my face and did not hear any comments passed my lips.
There was an Excel worksheet with more than 100 (one hundred) columns with more than 10000 rows, with all diversity of data in it. About 80 columns was in repeating groups, named “Date”, “Sum”, “Date”, “Sum” …. “Date”, “Sum” – without nesting or grouping.
For some reasons, when a VBA solution couldn’t be applied (especially if you work in Power BI and want to pull data in it without voodoo dances), the only way to flatten this table was using the Power Query for Excel 2010-2013 (or “Get Data” in Power BI, “Get & Transform” in Excel 2016).
Working on that task I discovered that there are at least four ways of doing it. You can choose the method that best suits your case.
As-is and to-be
What we have in source and what we need to get shown on the picture below:
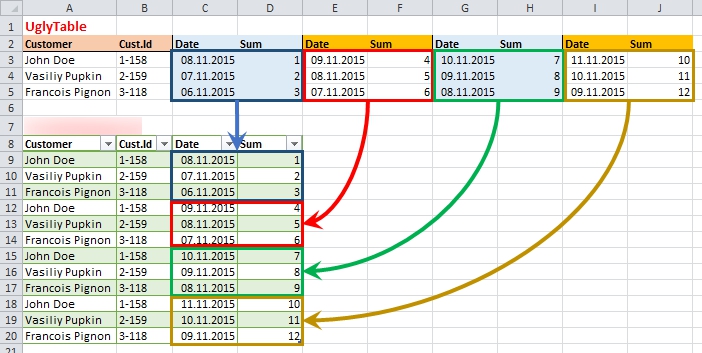
The source and the target: not so easy…
Actually we need to stack repeating groups one under other, keeping in place the common data from first columns.
Continue Reading →
Follow me:
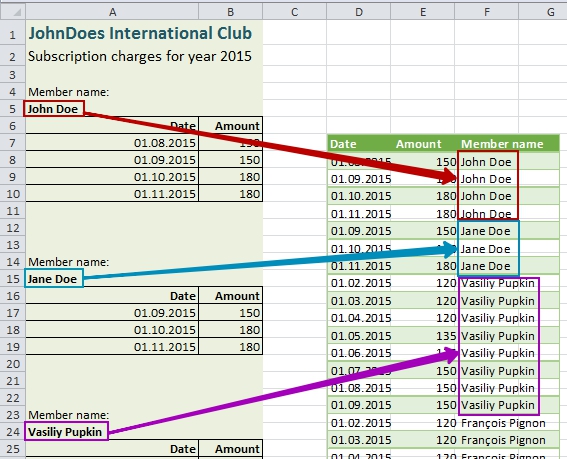
In my previous post I described how to pull a single value from one column and apply it as a new column’s value for specified rows. This kind of transformation could be applied when we have a mixed data source: one part of data is in a tabular form, and other part of data forms headers for these tables.
Now there is more complex task: we have a several values in separate rows, which (being taken together) form unique header for each data table. And the question is how to transform this header into new columns for tabular parts.
What we need to do is best illustrated by the picture:
What we have to do: attach title fields to data rows.
Continue Reading →
Follow me:
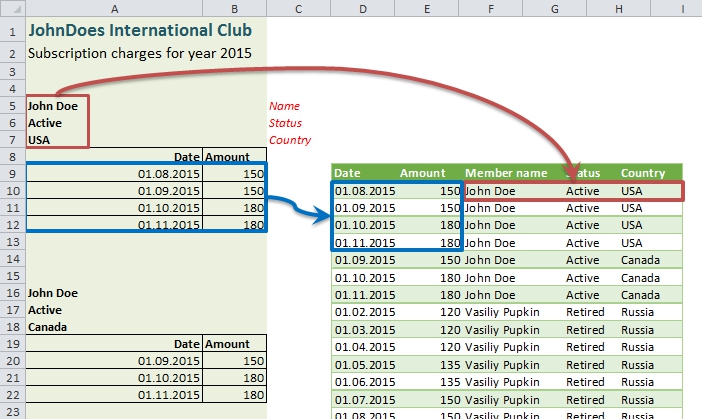
In my work I often meet data sources with a mix of tabular data and other useful info outside the tables. Usually it comes from some web reports or accounting programs output, where applied report criteria or other important data forms a header rows of report. While it is not so hard to make-up this data in Excel, it is better to avoid hand-made rinsing and washing every time we got a raw source updates. This becomes even more relevant when working with Power BI, where we don’t want or cannot make data preparation in Excel.
So here comes the cavalry Power Query with its outstanding abilities of raw data transformation.
(I really don’t sure how I should name this post)
The short preamble (“A long time ago…”)
You can imagine (and this is true!) that in almost every culture exists John Doe. Somehow these guys decide to unite and form a “JohnDoes International Club”. We do not know, what aims and goals of this club is (hope it is not “rule the world”), but anyway, this club exists with all necessary bureaucracy.
Every month club members have to pay membership charges. And every month club cashier got a report on charges collection.
The case
In this report we can see a standard header of what this document is about, and then information on each member’s charges. Each club member has own “table of charges” in this report, and each table precedes with two rows: pointer “Member name” and a member’ name itself.
In a sample report we can see four names: John Doe and Jane Doe form the USA, Vasiliy Pupkin from Russia and Francois Pignon from France (my apologies to monsieur Francois Dupont, but for me monsieur Pignon is already №1 due to beautiful comedies with Pierre Richard). Also please note that any coincidences to real people and clubs are accidental.
What we have to do is to make a flat table from the report:
Transfer values to a new column: things to do
Continue Reading →
Follow me:
PowerQuery is a great instrument that can do much more than just take data from source and pull it in a table or Power Pivot. We can clear and transform data in multiple ways, but there are some transformations, usual in Excel, which are not so convenient to make in Power Query.
For example, what if I need a relative reference to a specific “cell” (a value from exact row in exact column) in a PowerQuery table? Or reference to a value that is in specified column and 4 rows above from referencing row? In Excel this is obvious, I need just point on it with mouse, ensure that I removed “$” (absolute) signs from row part of reference, that’s all. But in PowerQuery I can’t do this so easy.
But anyway, a solution, still obscure, is reachable.
First of all, let’s found how we can access a particular value from a Power Query table.
The easiest way to understand item addressing in Power Query, in my mind, is analyzing of steps code.
Absolute row references
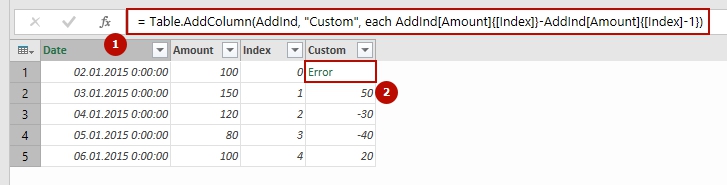
Suppose we have a simple table of two columns, “Date” and “Amount”. It has 5 rows, and in the first column it filled with, suddenly, dates, in second – some values:
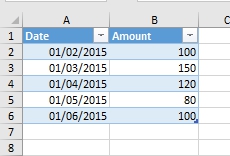
Source table
We would like to get a value from cell B4, exactly 120. Continue Reading →
Follow me: