List.Generate is the powerful unction of M language (the language of Power Query aka “Get & Transform” for Excel and Power BI query editor), used for lists generation using custom rules. Unlike in other list generators (like List.Repeat or List.Dates), the algorythm (and rules) of creation of successive element could be virtually any. This allows to use List.Generate to implement relatively complex get & transform tasks.
Although there are few excellent posts about this function uses (for example, Chris Webb, Gil Raviv, PowerPivotPro, KenR), I always I always lacked a more “clear” description — «How it actually works?» or «Why don’t it work?» and, at last, «What did the developers kept in mind when create this function?»
Generates a list of values given four functions that generate the initial value initial , test against a condition condition , and if successful select the result and generate the next value next . An optional parameter, selector , may also be specified.
Will you receive a list of four elements? Do you want to use an optional selector? Really? Why not?
In abandoned Power Query Formula Reference (August 2015) we can find the more clear description:
Generates a list from a value function, a condition function, a next function, and an optional transformation function on the values.
At least it is obvious that this function takes 4 arguments, all of type function:
Actually List.Generate uses quite simple loop algorythm. When creating an element of a new list, List.Generate evaluates a some variable (lets call it CurrentValue), which then passed from one argument-function to another in a loop:
Start value CurrentValue is the result of initial function evaluation.
Pass CurrentValue to condition function, check the condition and return true or false.
Ifcondition = false then stop list generation.
Ifcondition = true then create next element of the list with this rule:
If selector is passed to List.Generate and not is null, then pass CurrentValue to selector and evaluate its result.
Else (no selector at all or it is null) then the next element is equal to CurrentValue.
Evaluate next function with CurrentValue argument, and assign it’s result to the CurrentValue,so the new CurrentValue is evaluated next(CurrentValue).
Loop to Step 2.
As you can see from this not-so-technical description, the important difference of List.Generate from other iterator functions of M language is that almost all of others working in “For Each…Next” style (they have a fixed list to loop over), while List.Generate uses other logic – “Do While…Loop”, checking the condition before loop iteration. Subsequently, the number of elements in created list is limited only with “While” condition.
If we’ll write down the algorithm described above in other, non-functional language (like Visual Basic), it will look like that:
Visual Basic
1
2
3
4
5
6
7
8
9
10
11
12
DimNewList AsNewList
CurrentValue=initial()
DoWhilecondition(CurrentValue)
Ifselector=nullThen
NewList.Add(CurrentValue)
Else
NewList.Add(selector(CurrentValue))
EndIf
CurrentValue=next(CurrentValue)
Loop
Please note:
initial funciton has no arguments and its evaluated value is equal to its excression value.
Even when you try to write the initial function with arguments you cannot pass any argument to it, because it called somewhere inside of List.Generate.
To be honest I do not understand why initial IS a function but not a simple expression or value. May be there are reasons for it.
initial functionevaluated first
But, if the first call of condition function will return false, a list will not be created despite the initial function was evaluated.
In case of condition result is true then evaluated initial(or evaluated selector)will be the first element of the list. That’s why initial and next usually return same-structured values of the same type.
condition, next and selector got evaluated CurrentValueas an argument, but they don’t have to use it. Actually these three functions clould ignore CurrentValue, and use some other logic behind.
But, to be honest, I can’t imagine a situation when condition (or next ) do not use CurrentValue, because it leads to endless loop or list won’t be created.
selector evaluated despite of the result of next evaluation on the current loop iteration.
next always evaluated BEFORE the subsequent list element will be created (2nd and following).
When you create a list using some API calls (for example, you send GET or POST requests to API in initial and next functions), you should consider the following:
API will be called at least once (when initial is evaluated).
The number of API calls will always be at least one more than number of elements in created list (this excessive call is the result of the last next function evaluation, which didn’t passe the condition)
It is convenient when both initial and next return value of type record. This greatly simplifies the addition of counters and passing additional arguments for these functions (for example, one of record fileds is main data, second is counter, etc.).
Resuming, List.Generate is the powerfull tool, looking more complicated than in fact. Hope this post made it more friendly and comprehensible. 🙂
List.Generate – одна из функций языка “M” (язык Power Query aka “Get & Transform” для Excel и редактора запросов Power BI), используемая для создания списков (lists ) по заданным правилам. В отличие от других генераторов списков (например, List.Repeat или List.Dates), правила и алгоритм генерации очередного элемента может быть практически любым, что позволяет использовать List.Generate для решения достаточно сложных задач.
Несмотря на то, что есть несколько отличных постов, описывающих использование этой функции (например, Chris Webb, Gil Raviv, PowerPivotPro, KenR), мне всегда не хватало более понятного описания – “как же это всё работает?!” или “Почему оно не работает?” и, наконец, “Что вообще имели ввиду разработчики?”
Создает список значений с четырьмя функциями, которые создают начальное значение initial , проверяют выполнение условия condition и в случае успеха выбирают результат и формируют следующее значение next . Необязательный параметр selector может также быть указан.
Скажите, вы хотели бы использовать необязательный параметр selector ? Точно? Уверены?
Можно было бы списать на несовершенство перевода, но я вас уверяю, по-английски не лучше:
Generates a list of values given four functions that generate the initial value initial , test against a condition condition , and if successful select the result and generate the next value next . An optional parameter, selector , may also be specified.
Хотя на самом деле есть еще и краткое описание функции, которое выглядит чуть более внятно:
Создает список с указанием функции начального значения, функции условия, следующей функции и необязательной функции для преобразования значений.
По крайней мере, одно очевидно: функция принимает 4 аргумента, все 4 имеют тип function:
На самом деле функция List.Generate использует достаточно простой алгоритм. В процессе генерации каждого элемента списка функция рассчитывает значение (назовем его CurrentValue), которое модифицируется и передается от одной функции-аргумента к другой в следующем цикле:
Начальное значение CurrentValue= результат вычисления функции initial .
Передать CurrentValueна вход функции condition , проверить условие и дать ответ true или false
Если результат вычисления condition равен false –закончить создание списка.
Если результат вычисления condition равен true – создать очередной элемент списка по следующему правилу:
Если параметр selector задан, то вычислить значение функции selector, получив на вход CurrentValue.
Если параметр selector отсутствует, очередной элемент создаваемого списка будет равен CurrentValue.
Вычислить значение функции next (получив на вход CurrentValue) и присвоить переменной CurrentValueновое значение – результат этого вычисления.
Перейти к шагу 2.
Как можно увидеть из этого описания, важным отличием List.Generate от других функций-итераторов языка M является то, что практически все остальные работают по принципу
For Each…Next (то есть ограничены заданным списком перебора), в то время как List.Generate использует другую логику –
Do While…Loop . Соответственно, количество элементов в созданном списке ограничивается только выполнением некоего условия.
Если записать приведенный выше алгоритм на каком-нибудь привычном (не функциональном) языке, то он мог бы выглядеть примерно так:
Visual Basic
1
2
3
4
5
6
7
8
9
10
11
12
DimNewList AsNewList
CurrentValue=initial()
DoWhilecondition(CurrentValue)
Ifselector=nullThen
NewList.Add(CurrentValue)
Else
NewList.Add(selector(CurrentValue))
EndIf
CurrentValue=next(CurrentValue)
Loop
При этом:
Функция initial не имеет аргументов и ее вычисленное значение равно значению выражения, указанного внутри нее.
Если при написании initial вы укажете, что она должна принимать какие-то аргументы, у вас все равно не будет способа подать ей на вход значения, так как ее вызов происходит где-то внутри функции List.Generate.
Если честно, то я не понимаю, почему initial вообще задается как функция, а не сразу как вычисляемое ею значение. Наверное, для этого есть причины.
Сначала всегда вычисляется результат функции initial.
Если результат первой проверки condition будет false , то список не будет создан даже при том, что initial рассчитан.
Но если результат initial пройдет первую проверку, то именно он и будет первым элементом списка. Именно поэтому initial и next обычно генерируют одинаковые по типу и структуре значения.
Функции condition , next и selector получают на вход рассчитанное значение CurrentValue, но не обязаны его использовать. Фактически, эти три функции могут не обращать внимание на CurrentValue, и использовать какую-то другую логику.
Но, если честно, не представляю себе ситуацию, когда condition (или next ) не должна использовать CurrentValue, так как это приведет либо к бесконечному циклу, либо список не будет создан.
Функции next и selector вычисляются только при условии conditon = true .
Функция selector вычисляется вне зависимости от результата функции next, рассчитанного на текущем шаге цикла.
Функция next вызывается всегда ДО создания следующего элемента списка (2-го и далее).
Например, если вы создаете список в процессе работы с каким-либо API (например, в функциях initial и next посылаете запросы на подготовку или получение отчетов), имейте ввиду следующее:
Как только List.Generate вызывается, API опрашивается как минимум 1 раз, при вычислении initial .
Количество обращений к API всегда будет как минимум на 1 больше, чем количество элементов в созданном списке (этот лишний – последний результат расчета функции next , не прошедший проверку condition )
Удобнее всего, когда initial и next возвращают тип
record . Это сильно упрощает добавление счётчиков и дополнительных аргументов для этих функций (одно из полей записи – основные данные, другое – счетчик, третье – какой-то еще параметр, используемый для генератора элементов, и так далее).
В итоге, List.Generate – это очень мощный по возможностям инструмент, хотя и немного тяжелый в освоении . Надеюсь, после этой статьи он стал понятнее и дружелюбнее. 🙂
Какое-то время назад Максим Уваров предложил мне поучаствовать в создании регулярного вебкаста о Power BI. Долго ли, коротко ли (на самом деле долго), но Максим наконец-то вернулся из Таиланда, я собрался наконец-то с мыслями, и мы в один присест записали пилотный выпуск, который пришлось разделить на три части из-за его длины (просто очень много хотелось рассказать).
Собственно, вот эти три части:
Часть 1 – говорим об изменениях в системе лицензирования Power BI, объявленных в мае 2017 года: Power BI Premium, конец халявы для Free-лицензий и так далее:
Часть 2 – первые впечатления от работы с Power Query SDK – основным подарком разработчикам от Microsoft в мае 2017 (даже не знаю, будет ли что-то такое же революционное в ближайшее время, разве что новый API внезапно появится):
Недавно я опубликовал пост о ловушке UsedRange, в которую вы можете попасть при импорте данных с листа Excel в Power Query (вы можете прочесть его тут).
Чтобы добавить возможность импорта в Power Query данных с заданных диапазонов на листе, я создал соответствующие темы на форумах excel.uservoice.com и https://ideas.powerbi.com
Проголосуйте, пожалуйста, за эти улучшения – они могут не только сэкономить вам несколько строк кода, но и спасти от потенциальных ошибок при работе с неструктурированными данными в Excel.
Please add your votes to these improvements – I’m sure they can not only save you a few rows of code but also can save you from potential pitfalls when working with raw Excel data.
When you import data from an Excel workbook to the Power Query or Power BI from entire sheet, be careful, there is a pitfall.
After linking to an external Excel file there are three options of data extracting available:
From table (table-formatted range of cells in the sheet),
From custom named range of cells,
From entire sheet
In the first case, a Table object is already structured data with columns’ names, automatically transformed to PQ tables. In the second case, Power Query shall give the named range generic titles (Column1, Column2, etc.) and then work as before.
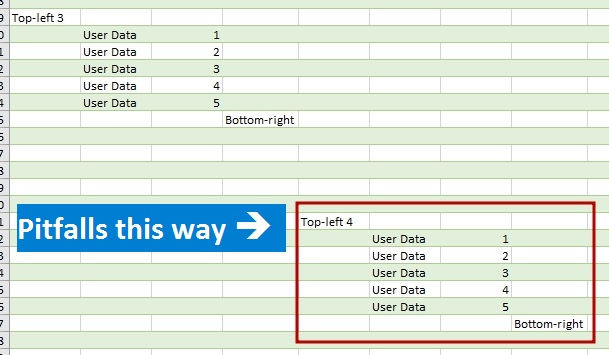
However, it is often the case that data are not structured in a formatted table or named range, and it can be difficult to transform them to such view before import. There can be many reasons for that, e.g., cells format is to be saved (merged cells are no longer merged after transformation) or there are too many files to transform them manually.
Data on a “raw” sheet
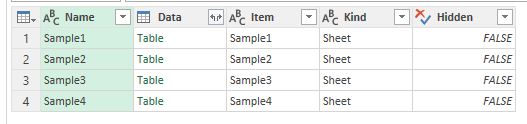
Fortunately, Power Query can extract data from the whole sheet. To get data from unformatted sheet you do not need to perform any special actions: just connect to the file, find the needed sheet (it will have “Sheet” value in the [Kind] column) and get data by retrieving its content from the [Data] column:
Excel sheets available as data sources just as tables or named ranges
The question is: what data range will be retrieved in that case? There are 17 179 869 184 cells on an Excel sheet (16 384 columns and 1 048 576 rows). If Power Query try to get them all, there will be huge memory consumption and performance leak. However, we can ensure that usually number of imported rows and columns is about the same as the number of rows and columns with the data may be slightly bigger.
So how Power Query defines a data range on a sheet? The answer is out there if you familiar with VBA macros and have enough experience with an Excel object model (but I think you will not be glad with this answer).
Если вы импортируете данные в Power Query или Power BI из файла Excel, обращаясь к листу целиком, будьте осторожны – вас может поджидать ловушка.
При подключении к стороннему файлу Excel нам доступны три варианта извлечения данных:
Таблица (форматированный как таблица диапазон ячеек на листе)
Именованный диапазон (диапазон ячеек, которому присвоено пользовательское имя)
Лист целиком
В первом случае объект «Таблица» представляет собой уже структурированные данные с заголовками столбцов, которые впоследствии автоматически трансформируются в таблицы. Во втором случае Power Query снабдит именованный диапазон автоматическими заголовками (“Column1”, “Column2” и так далее), и дальнейшая обработка не отличается от импортированных таблиц.
Однако очень часто нужные данные не находятся в форматированной таблице или именованном диапазоне, и преобразовать их в такой вид затруднительно. Причин может быть много, например, необходимо сохранить форматирование (объединение ячеек теряется при преобразовании в таблицу), либо файлов слишком много для ручного преобразования в нужный формат.
Данные с неразмеченного листа
К счастью, Power Query может получить данные с листа целиком. Для того чтобы получить данные из неразмеченного листа, никаких особых действий предпринимать не нужно: подключаемся к файлу, находим нужный лист (в столбце [Kind] он будет иметь значение “Sheet”) и получаем данные путем обращения к его содержимому в столбце [Data]:
Листы Excel доступны в качестве источника наравне с таблицами и именованными диапазонами
Однако возникает вопрос, какие данные попадут в таблицу для этого листа? На листе Excel 17 179 869 184 ячеек (16 384 столбцов и 1 048 576 строк). Если бы Power Query пытался загрузить их все, это привело бы к безнадежным «тормозам» при импорте данных таким образом. Однако мы можем убедиться, что обычно количество строк и столбцов примерно соответствует заполненным.
Как же Power Query определяет нужный диапазон данных? Ответ может быть достаточно очевиден, если у вас есть достаточный опыт программирования на VBA и вы хорошо знакомы с объектной моделью Excel (и ответ вас не обрадует). Continue Reading →
Несколько дней назад мой клиент поинтересовался, возможно ли динамически (при помощи среза) изменить набор рядов, отображаемых на диаграмме Power BI. Мой первый (инстинктивный) ответ был “Да, конечно, вы можете использовать срез, чтобы выбрать отображаемые на диаграмме ряды, просто поместите нужный столбец в срез”. Но затем клиент уточнил: выбирать на диаграмме нужно разные меры, а не разные категории из столбца. Второй (не менее инстинктивный) ответ был “Нет, это невозможно. Срез может только фильтровать столбец, и поместить меры в срез нельзя”.
Однако после некоторого обсуждения я засомневался, действительно ли это невозможно. Если мы поместим меру в область значений (“Value”) диаграммы, она будет показана как ряд (например, какая-то мера [Total Amount]). А что на самом деле нужно моему клиенту? Он хочет выбрать какие-то значения на срезе и, если некоторое значение выбрано, показать соответствующую меру. Если значение не выбрано, то не показывать эту меру.
На самом деле элементы среза это уникальные значения какого-то столбца. Срез применяет фильтр к этому столбцу. Можем мы понять, что столбец отфильтрован? Да, конечно, мы можем это сделать при помощи формул DAX. Если нужное значение выбрано, то мы должны показать меру как ряд на диаграмме. Так как эта мера уже находится в области значений диаграммы, то нам нужно, попросту говоря, “ничего не делать”. Собственно, нам необходимо только как-то спрятать меру, если нужное значение не выбрано на срезе.
A few days ago a client asked me if it is possible to dynamically change series displayed on Power BI chart. My first (instinctive) answer was “Yes, of course, you can use a slicer to select which series you want to show, just put desired column in a slicer visual”. But then he added details: he wanted to select a measure to display on a chart, not to filter a value from column. My second (instinctive) answer was “No, you can’t. You can only filter a column, and can’t place measures in a slicer”.
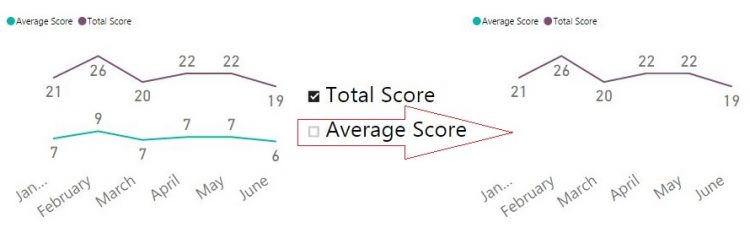
But after a little chat I started to wonder whether it is really impossible. If we put a measure in a “Value” well of chart fields, it will be shown as a series (for example, some [Total Amount] measure). What my client is actually wants? He want to choose some elements on the slicer and, if one element selected, to show a measure. If that element is unchecked, then don’t show a measure.
Actually, those slicer’s elements are unique values from some column. A slicer applies a filter to that column. Can we catch whether a column is filtered? Yes, of course, we can do it with DAX. And if some desired value is selected, we just need to show a measure as a series. As that measure is already in the “Value” well of a chart, then, in other words, we just have to “do nothing”. So, we only need to somehow hide a measure if a desired slicer’s element didn’t selected.
‘M’ (a Power Query Formula language) is a very powerful and interesting, but sometimes it could be a little confusing because of its lazy behavior.
Yesterday a friend of mine asked me for help with custom API connector in Power Query / Power BI. This connector has to work as follows:
Post report requests
Wait for reports completion
Download reports
On the step 2 my friend used Function.InvokeAfter() built-in Power Query function, which supposed to pause code for a few seconds. But his code didn’t worked as expected – It looks like there are no requests posted at all.
We’ve found a solution to his task, but to make a long story short, there is what I have found from this case.
As we can imagine from ‘M’ evaluation rules, to get “a” we need to calculate “b” first. We can suppose that before evaluation of value “a” there goes value “b” evaluation. So, we’ll get “b” (current time), then extract current time from the same current time and get zero.
No way. The result is about -2 seconds: -00:00:02.0183210
Why? It is not so obvious, but there is a very easy answer: ‘M’ evaluates a value from left to right. When ‘M’ check for the a expression, it calculate first part:
The result of “b” is the local datetime with 2 seconds delay, so it is two seconds later than “a”. Of course, a – b approximately equals to -2 seconds.
There I changed evaluation order in the “a” expression, so now “b” is evaluated first, then second part (
DateTimeZone.LocalNow() ) is evaluated. As this evaluation is very quick, we have no delay and got the same time as in “b”. The new result is 0, zero.
So, what I have found here is that relatively complex expressions in ‘M’ evaluates from left to right.
There is another interesting result. Let us see the next code:
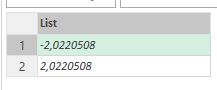
The result of this code should be a list with two values. What I expected from previous example? There should be something like {-2, 0}, like results of previous calculations.
No way. The result is {-2, 2}:
Why there is a different result?
The reason is the lazyness of ‘M’: when the first element of the list evaluated, then it works like in example above: evaluate “a” then evaluate “b” (plus 2 sec), extract “b” from “a”. But for the second element ‘M’ did not make any evaluations of “a” or “b”. They already evaluated, so, as “b” is bigger than “a” for 2 seconds, extraction gives me +2.
Now I can easily explain why: when evaluating the first element, b-a, the “b” evaluated first, then “a”immediately evaluated and it equals to “b”, and we get a zero as the result of extraction. Already calculated “a” and “b” then swap their places and give us the same result.
It looks as a very interesting finding for me. I think I have to keep it in mind when I’ll try to implement some time-delayed evaluations in queries.