Recently I posted about UsedRange trap when importing from Excel sheet in Power Query (you can read this post there).
To add an option for users who can meet the same problems as me I’ve added corresponding Power Query improvement ideas on excel.uservoice.com and https://ideas.powerbi.com
Please add your votes to these improvements – I’m sure they can not only save you a few rows of code but also can save you from potential pitfalls when working with raw Excel data.
Thank you!
Follow me: 


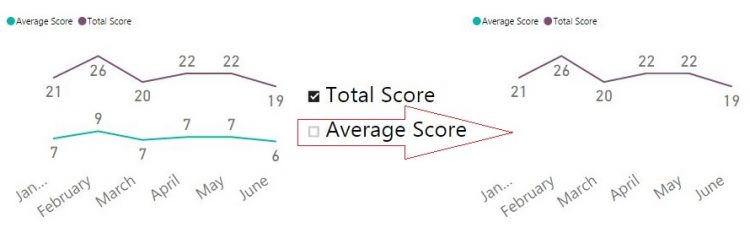
A few days ago a client asked me if it is possible to dynamically change series displayed on Power BI chart. My first (instinctive) answer was “Yes, of course, you can use a slicer to select which series you want to show, just put desired column in a slicer visual”. But then he added details: he wanted to select a measure to display on a chart, not to filter a value from column. My second (instinctive) answer was “No, you can’t. You can only filter a column, and can’t place measures in a slicer”.
But after a little chat I started to wonder whether it is really impossible. If we put a measure in a “Value” well of chart fields, it will be shown as a series (for example, some [Total Amount] measure). What my client is actually wants? He want to choose some elements on the slicer and, if one element selected, to show a measure. If that element is unchecked, then don’t show a measure.
Actually, those slicer’s elements are unique values from some column. A slicer applies a filter to that column. Can we catch whether a column is filtered? Yes, of course, we can do it with DAX. And if some desired value is selected, we just need to show a measure as a series. As that measure is already in the “Value” well of a chart, then, in other words, we just have to “do nothing”. So, we only need to somehow hide a measure if a desired slicer’s element didn’t selected.
Continue Reading →
Follow me:
The history of “reinventing the bicycle” using DAX
Defining evaluation context and context transition rules is the most important and confusing part of DAX. Sometimes when you think you’ve already managed it, DAX turns to you with other side, hook, uppercut – and you’re knocked down.
Last week one of my Facebook friends asked me to explain why his measures working this way and not that way. It was quite easy questions and there is no sense to place them here. But my friend is a very curious man, one question led to another, and suddenly I found that I can’t explain a very simple, on the first look, concept. The question was about filtering under context transition in calculated column (here you can imagine a very big grin on DAX’s face).
For this post I reworked and simplified data model.
There are two tables, named
‘Managers’ and
‘Sales’ .
‘Managers’ has only two columns:
[Manager] and
[Department] .
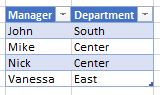
‘Managers’ table
‘Sales’ has a little bit more columns (although it doesn’t matter here):
[Order] ,
[Manager] ,
[Amount] and
[Order type] .
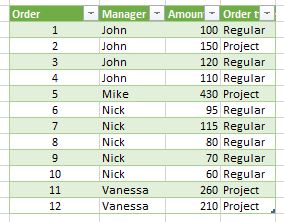
‘Sales’ table
As you can see, they are linked one-to-many by
[Manager] column. Quite easy.
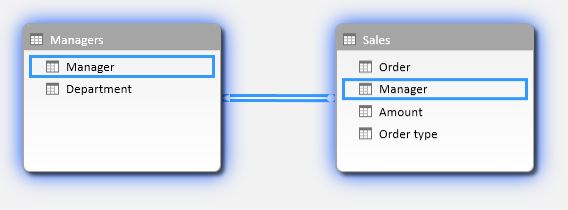
Data Model
First of all my friend asked me, how context transition works. “Hey, it’s easy!” – I said, and Continue Reading →
Follow me:
There are many ways to get a value from parameters table and then pass it to query. One of this methods uses direct selection of unique parameter name. I think it worth a post.
Items selection: brief reminder
As I described in my first ever post “Absolute and Relative References in Power Query”, when we would like to refer to a single item in a list or a cell in a Power Query table, we can use
Name{Argument} syntax:
TableName{Row} or
ListName{Element} . If
Name is a table or list, and
Argument is number, then it is simple: we asking for a row or element of such position.
The most commonly used syntax for single cell addressing in tables is
|
|
Table{RowNumber}[FieldName] |
But it is often omitted that if
Name is a table,
Argument could be not a number but a record:
Quick filter for unique values
Value passed as
Record in this expression works like a filter for a matching field in the table. For example,
[empl_name = “John”] .
How it works and what is in it for practical uses?
If
- our table has a column named
empl_name
and
- row with value “John” in this column could be found,
and
- this row is unique (i.e. there is only one row with value “John” in column
empl_name , matching to the
Record ),
then entire record (i.e. row) will be returned as the result of this expression. In other words, a unique matching record from the table.
But there is one important restriction: if there is no unique matching row in the table, an error is raised.
So, when
Table{Record} returns a desired result, it has type of record and we can reach a single item from this record by referring to desired field in it:
We can see this method in action when we build query to a table from Excel file. Power Query will create such string of code automatically:
|
|
= Excel.CurrentWorkbook(){[Name="Parameters"]}[Content] |
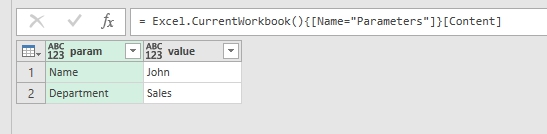
How Power Query refers to a table in Excel workbook
Implications
For example, we would like to implement table for passing user-defined parameters to Power Query (I recommend this great post “Building a Parameter Table” by Ken Puls):
|
|
myTable = #table(type table [param = text, value = text],{{"Name","John"},{"Department","Sales"}}), person = myTable{[param = "Name"]}[value], dept = myTable{[param = "Department"]}[value] |
In this example in the first row we create a parameters table with columns param and value that is supposed to be a parameters table for use in other queries.
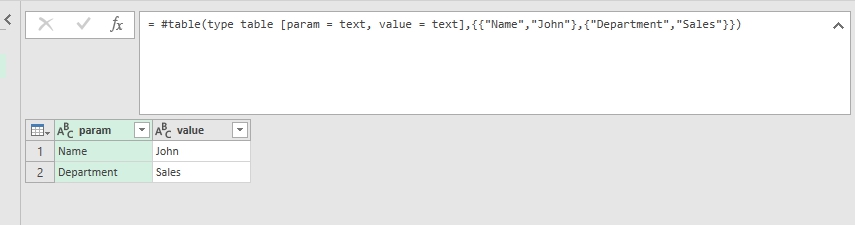
Hardcoded parameters table (just for sample)
Then we got a parameter’s value by applying “record filter” and selecting desired field (
[value]):
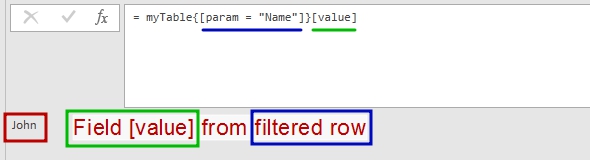
Now we can quickly get “Name” parameter’ value from the table above
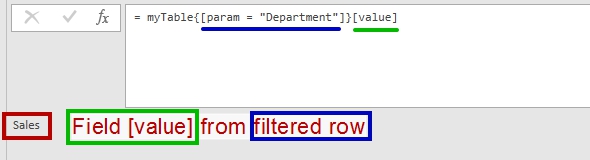
And “Department” parameter’ value from the table above. Any unique parameter.
What are the benefits in this approach?
- First of all, we do not need to remember a desired parameter row when coding (what if user swapped rows in parameters table?).
- Then, we do not need to filter parameters table each time to get a desired value.
- And also we can check for parameters table integrity – if there will be several rows with the same parameter name, or missing parameter value, or missing field, then we’ll got an error and can handle it.
And, don’t forget that this
Table{Record} method has a lot of other uses – when we really need to get a record as a result of expression. Also we can pass a more complex (with 2 or more fields) record as filter.
And
Argument record could be a result from other queries. Lets name this query as “QueryRecord”:
|
|
let Source = #table(type table [Name = text, Department = text, Region=text],{{"John","Sales","AL"},{"Jim","IT","FL"}}), QueriedRecord = Record.RemoveFields(Source{0},{"Region"}) in QueriedRecord |
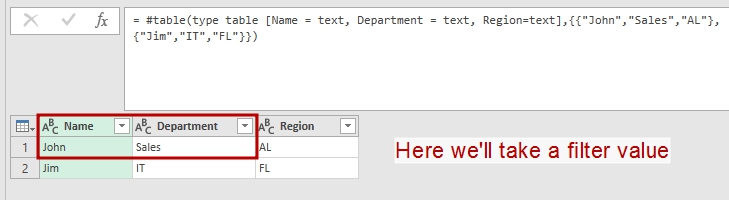
We’ll take a record from this table
The result of above query is a record with two fields:
[Name = "John", Department = "Sales"] .
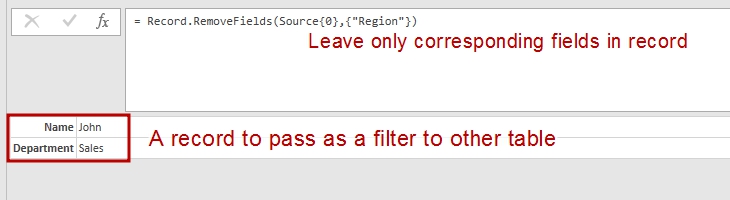
I leaved only needed fileds in this record
Then we pass it as an filter argument to other table:
|
|
let Source = #table(type table [Name = text, Department = text, Date = text],{{"John","Sales","01.01.16"},{"Jim","IT","02.01.16"}}), ChType = Table.TransformColumnTypes(Source,{{"Date", type date}}), Filtered = try ChType{QueryRecord} otherwise null in Filtered |
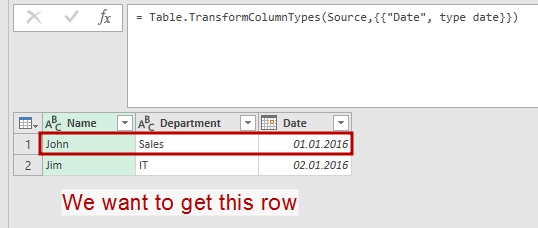
We will filter this table with the result of previous query
The result is a desired record:
|
|
[Name = "John", Department = "Sales", Date = "01.01.2016"] |
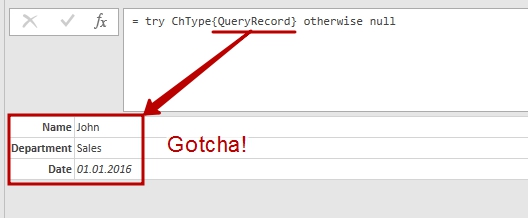
Hey-ho, it works!!!
Another one “Get parameter” function
And a cherry on the cake – quick parameter selection function. You can easy change it for your needs:
|
|
(param_table as table, param_name as text) => let fnParam = try param_table{[param=param_name]}[value] otherwise null in fnParam |
You can also find a complete description of item selection in “Microsoft Power Query for Excel Formula Language Specification” (see “6.4.1 Item Access” on page 59 in August 2015 edition).
Follow me:
In my mind List.Accumulate is one of most undocumented and most underestimated functions in Power Query ‘M’ language. In this post I would like to continue explanation of this very interesting iterative function.
Data types
In my previous post about List.Accumulate function in Power Query ‘M’ language I’ve mentioned that seed value, passed to function, could be any. As it was described in Gil Raviv post,
The seed argument (or as we call it the initial state), should be of the same type as the first argument of your accumulator function and of the same type as of the function’s output.
Now I want to add more details to an explanation of the List.Accumulate arguments’ behavior:
- We can pass a seed value of any allowed in Power Query data type to function. What we can pass as a seed: table, list, number, date, record, null, duration… anything.
- Actually (and here I’d like to correct Gil) function’s output type is independent from the seed type.
- Function output type depends only from data type returned by accumulator sub–function. Real output type could be any:
|
|
List.Accumulate({1,2,3},0,(state, current)=>(if state = 0 then "" else Text.From(state))&Text.From(current)) // equals “123” |
- The first (state) argument in accumulator sub-function has to be the same type as seed value only at first iteration and only if state argument is used in accumulator (I really see no sense in manipulations without using state argument, but you can do it, that’s why I noted it). After the first iteration the accumulator result will totally depend on what this sub-function does (as shown above).
- The list elements could be used in accumulator sub-function. Could be not. You can use the list only as iteration counter – accumulator will perform its manipulations as many times as the count of list elements. This means that you can use List.Accumulate as “For Each … Next” loop (which has as many steps as a count of elements in list).
Let us try to look at how those features could be implemented.
SUMPRODUCT () in Power Query
For a starter let’s try to convert the famous Excel function, SUMPRODUCT, to Power Query function.
Why we really need it?
There are a lot of ways to implement SUMPRODUCT in Power Query. For example, we can add custom column with formula like this: = [Amount] * [Price] and then just get the sum of it. It’s easy and clear, except we need to add this helper column to get just one number.
But let suppose we have got two lists by some query manipulations and these lists are not columns in any table. We can transform them to tables, and then somehow combine those tables, perhaps with Index column, and… looks not as easy as it was with columns in one table?
SUMPRODUCT itself
With List.Accumulate we can do it with just one row of code:
|
|
let myList1 = {1,1,2,2,4,5}, myList2 = {1,4,2,2,1,5}, SUMPRODUCT = List.Accumulate(MyList1, [Sum=0, Index=0], (state, current) => [Sum = current * MyList2{state[Index]}+state[Sum], Index = state[Index]+1])[Sum] in SUMPRODUCT |
Obviously it equals 42.
How it works
- Here we got two lists of the same size, MyList1 and MyList2
- We’ll use one of lists as an list argument of List.Accumulate. We actually will use its elements in calculation, but also the count of list elements will be used as a counter to iterations inside our function.
- As the seed argument we used a record: [Sum=0, Index =0], where Sum will be used as field for calculation and Index will be used as list’s current position counter.
- We can describe the accumulator function as follows:
- For Each current element In MyList1
- Multiply current on MyList2{state[Index]} (where state[Index] is the value of Index from previous step or from seed if it is first step)
- Add the result to the state[Sum] (where state[Sum] is the previous/seed value of Sum)
- Increase previous/seed value of Index by 1
- Next
- At the end of the loop we have the result as a record of two fields: Sum and Index, as a result of Accumulate. We need only Sum field value, so we just add this filed name in square brackets at the end of row to get its value. Actually it means “give me the value of the [Sum] field from List.Accumulate result”.
SUMPRODUCT() UDF for PowerQuery/’M’
You can easily transform code from above to the one-row function for future uses:
|
|
(MyList1 as list, MyList2 as list) as number => let SUMPRODUCT = List.Accumulate(MyList1, [Sum=0, Index=0], (state, current) => [Sum = current * MyList2{state[Index]} + state[Sum], Index = state[Index] + 1])[Sum] in SUMPRODUCT |
Of course, you can enhance it with error handling and other feautures, as you want.
Enjoy! 🙂
(to be continued)
Follow me: