Recently I needed to do the very simple thing in Power Query. I have the column of numbers and need to check if the values in this column are less than N and then put a corresponding text value in the new column. The function for the new column is something like this:
|
|
= if [Values] < 5 then "A" else "B" |
Actually some values are not a numbers but nulls:
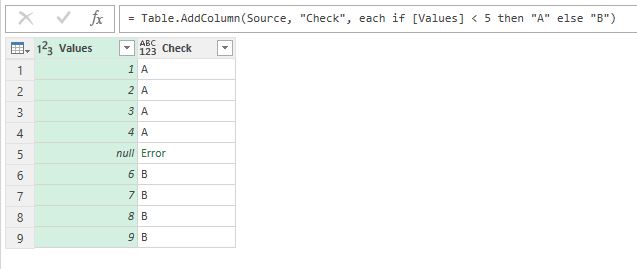
Data contains nulls and comparison return an error
And this simple calculation returns an error for these values!
Why? There is the catch, which is hidden in the depth of documentation (actually on the page 67 of the “Power Query Formula Language Specification (October 2016)” PDF which you can obtain there.
Continue Reading →
Follow me: 


List.Generate is the powerful unction of M language (the language of Power Query aka “Get & Transform” for Excel and Power BI query editor), used for lists generation using custom rules. Unlike in other list generators (like List.Repeat or List.Dates), the algorythm (and rules) of creation of successive element could be virtually any. This allows to use List.Generate to implement relatively complex get & transform tasks.
Although there are few excellent posts about this function uses (for example, Chris Webb, Gil Raviv, PowerPivotPro, KenR), I always I always lacked a more “clear” description — «How it actually works?» or «Why don’t it work?» and, at last, «What did the developers kept in mind when create this function?»
As usual, MSDN help article is laconical:
Generates a list of values given four functions that generate the initial value initial , test against a condition condition , and if successful select the result and generate the next value next . An optional parameter, selector , may also be specified.
Will you receive a list of four elements? Do you want to use an optional selector? Really? Why not?
In abandoned Power Query Formula Reference (August 2015) we can find the more clear description:
Generates a list from a value function, a condition function, a next function, and an optional transformation function on the values.
At least it is obvious that this function takes 4 arguments, all of type function:
|
|
List.Generate(initial as function, condition as function, next as function, optional selector as nullable function) as list |
Actually List.Generate uses quite simple loop algorythm. When creating an element of a new list, List.Generate evaluates a some variable (lets call it CurrentValue), which then passed from one argument-function to another in a loop:
- Start value CurrentValue is the result of initial function evaluation.
- Pass CurrentValue to condition function, check the condition and return true or false.
- Ifcondition = false then stop list generation.
- Ifcondition = true then create next element of the list with this rule:
- If selector is passed to List.Generate and not is null, then pass CurrentValue to selector and evaluate its result.
- Else (no selector at all or it is null) then the next element is equal to CurrentValue.
- Evaluate next function with CurrentValue argument, and assign it’s result to the CurrentValue, so the new CurrentValue is evaluated next(CurrentValue).
- Loop to Step 2.
As you can see from this not-so-technical description, the important difference of List.Generate from other iterator functions of M language is that almost all of others working in “For Each…Next” style (they have a fixed list to loop over), while List.Generate uses other logic – “Do While…Loop”, checking the condition before loop iteration. Subsequently, the number of elements in created list is limited only with “While” condition.
If we’ll write down the algorithm described above in other, non-functional language (like Visual Basic), it will look like that:
|
|
Dim NewList As New List CurrentValue = initial() Do While condition(CurrentValue) If selector = null Then NewList.Add(CurrentValue) Else NewList.Add(selector(CurrentValue)) End If CurrentValue = next(CurrentValue) Loop |
Please note:
- initial funciton has no arguments and its evaluated value is equal to its excression value.
Even when you try to write the initial function with arguments you cannot pass any argument to it, because it called somewhere inside of List.Generate.
To be honest I do not understand why initial IS a function but not a simple expression or value. May be there are reasons for it.
- initial function evaluated first
But, if the first call of condition function will return false, a list will not be created despite the initial function was evaluated.
In case of condition result is true then evaluated initial (or evaluated selector) will be the first element of the list. That’s why initial and next usually return same-structured values of the same type.
- condition, next and selector got evaluated CurrentValue as an argument, but they don’t have to use it. Actually these three functions clould ignore CurrentValue, and use some other logic behind.
But, to be honest, I can’t imagine a situation when condition (or next ) do not use CurrentValue, because it leads to endless loop or list won’t be created.
- selector evaluated despite of the result of next evaluation on the current loop iteration.
- next always evaluated BEFORE the subsequent list element will be created (2nd and following).
When you create a list using some API calls (for example, you send GET or POST requests to API in initial and next functions), you should consider the following:
- API will be called at least once (when initial is evaluated).
- The number of API calls will always be at least one more than number of elements in created list (this excessive call is the result of the last next function evaluation, which didn’t passe the condition)
It is convenient when both initial and next return value of type record. This greatly simplifies the addition of counters and passing additional arguments for these functions (for example, one of record fileds is main data, second is counter, etc.).
Resuming, List.Generate is the powerfull tool, looking more complicated than in fact. Hope this post made it more friendly and comprehensible. 🙂
Follow me:
Recently I posted about UsedRange trap when importing from Excel sheet in Power Query (you can read this post there).
To add an option for users who can meet the same problems as me I’ve added corresponding Power Query improvement ideas on excel.uservoice.com and https://ideas.powerbi.com
Please add your votes to these improvements – I’m sure they can not only save you a few rows of code but also can save you from potential pitfalls when working with raw Excel data.
Thank you!
Follow me:
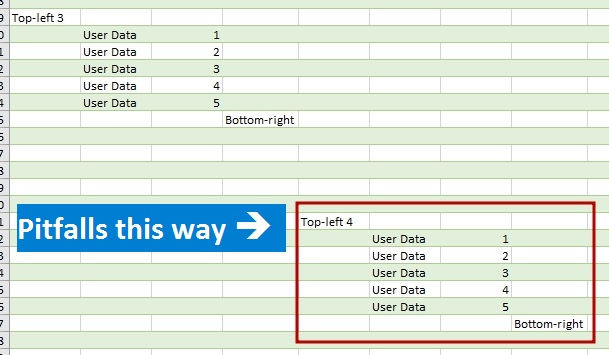
When you import data from an Excel workbook to the Power Query or Power BI from entire sheet, be careful, there is a pitfall.
After linking to an external Excel file there are three options of data extracting available:
- From table (table-formatted range of cells in the sheet),
- From custom named range of cells,
- From entire sheet
In the first case, a Table object is already structured data with columns’ names, automatically transformed to PQ tables. In the second case, Power Query shall give the named range generic titles (Column1, Column2, etc.) and then work as before.
However, it is often the case that data are not structured in a formatted table or named range, and it can be difficult to transform them to such view before import. There can be many reasons for that, e.g., cells format is to be saved (merged cells are no longer merged after transformation) or there are too many files to transform them manually.
Data on a “raw” sheet
Fortunately, Power Query can extract data from the whole sheet. To get data from unformatted sheet you do not need to perform any special actions: just connect to the file, find the needed sheet (it will have “Sheet” value in the [Kind] column) and get data by retrieving its content from the [Data] column:
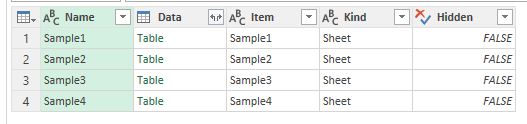
Excel sheets available as data sources just as tables or named ranges
The question is: what data range will be retrieved in that case? There are 17 179 869 184 cells on an Excel sheet (16 384 columns and 1 048 576 rows). If Power Query try to get them all, there will be huge memory consumption and performance leak. However, we can ensure that usually number of imported rows and columns is about the same as the number of rows and columns with the data may be slightly bigger.
So how Power Query defines a data range on a sheet? The answer is out there if you familiar with VBA macros and have enough experience with an Excel object model (but I think you will not be glad with this answer).
Continue Reading →
Follow me:
The history of “reinventing the bicycle” using DAX
Defining evaluation context and context transition rules is the most important and confusing part of DAX. Sometimes when you think you’ve already managed it, DAX turns to you with other side, hook, uppercut – and you’re knocked down.
Last week one of my Facebook friends asked me to explain why his measures working this way and not that way. It was quite easy questions and there is no sense to place them here. But my friend is a very curious man, one question led to another, and suddenly I found that I can’t explain a very simple, on the first look, concept. The question was about filtering under context transition in calculated column (here you can imagine a very big grin on DAX’s face).
For this post I reworked and simplified data model.
There are two tables, named
‘Managers’ and
‘Sales’ .
‘Managers’ has only two columns:
[Manager] and
[Department] .
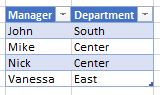
‘Managers’ table
‘Sales’ has a little bit more columns (although it doesn’t matter here):
[Order] ,
[Manager] ,
[Amount] and
[Order type] .
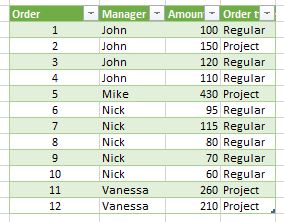
‘Sales’ table
As you can see, they are linked one-to-many by
[Manager] column. Quite easy.
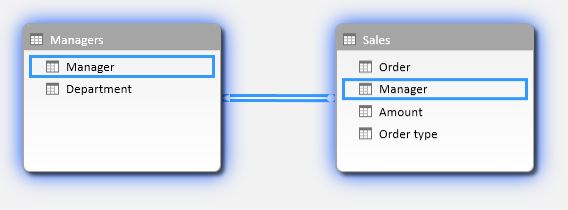
Data Model
First of all my friend asked me, how context transition works. “Hey, it’s easy!” – I said, and Continue Reading →
Follow me:
There are many ways to get a value from parameters table and then pass it to query. One of this methods uses direct selection of unique parameter name. I think it worth a post.
Items selection: brief reminder
As I described in my first ever post “Absolute and Relative References in Power Query”, when we would like to refer to a single item in a list or a cell in a Power Query table, we can use
Name{Argument} syntax:
TableName{Row} or
ListName{Element} . If
Name is a table or list, and
Argument is number, then it is simple: we asking for a row or element of such position.
The most commonly used syntax for single cell addressing in tables is
|
|
Table{RowNumber}[FieldName] |
But it is often omitted that if
Name is a table,
Argument could be not a number but a record:
Quick filter for unique values
Value passed as
Record in this expression works like a filter for a matching field in the table. For example,
[empl_name = “John”] .
How it works and what is in it for practical uses?
If
- our table has a column named
empl_name
and
- row with value “John” in this column could be found,
and
- this row is unique (i.e. there is only one row with value “John” in column
empl_name , matching to the
Record ),
then entire record (i.e. row) will be returned as the result of this expression. In other words, a unique matching record from the table.
But there is one important restriction: if there is no unique matching row in the table, an error is raised.
So, when
Table{Record} returns a desired result, it has type of record and we can reach a single item from this record by referring to desired field in it:
We can see this method in action when we build query to a table from Excel file. Power Query will create such string of code automatically:
|
|
= Excel.CurrentWorkbook(){[Name="Parameters"]}[Content] |
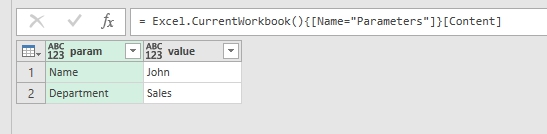
How Power Query refers to a table in Excel workbook
Implications
For example, we would like to implement table for passing user-defined parameters to Power Query (I recommend this great post “Building a Parameter Table” by Ken Puls):
|
|
myTable = #table(type table [param = text, value = text],{{"Name","John"},{"Department","Sales"}}), person = myTable{[param = "Name"]}[value], dept = myTable{[param = "Department"]}[value] |
In this example in the first row we create a parameters table with columns param and value that is supposed to be a parameters table for use in other queries.
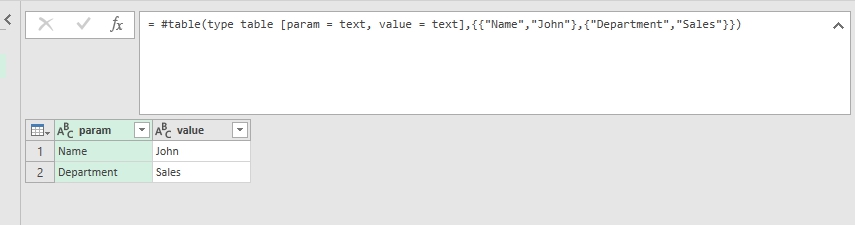
Hardcoded parameters table (just for sample)
Then we got a parameter’s value by applying “record filter” and selecting desired field (
[value]):
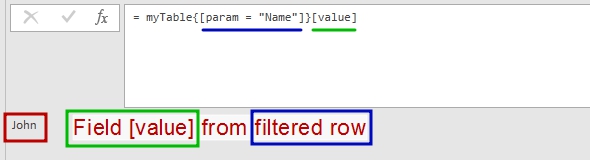
Now we can quickly get “Name” parameter’ value from the table above
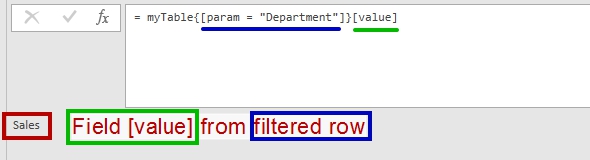
And “Department” parameter’ value from the table above. Any unique parameter.
What are the benefits in this approach?
- First of all, we do not need to remember a desired parameter row when coding (what if user swapped rows in parameters table?).
- Then, we do not need to filter parameters table each time to get a desired value.
- And also we can check for parameters table integrity – if there will be several rows with the same parameter name, or missing parameter value, or missing field, then we’ll got an error and can handle it.
And, don’t forget that this
Table{Record} method has a lot of other uses – when we really need to get a record as a result of expression. Also we can pass a more complex (with 2 or more fields) record as filter.
And
Argument record could be a result from other queries. Lets name this query as “QueryRecord”:
|
|
let Source = #table(type table [Name = text, Department = text, Region=text],{{"John","Sales","AL"},{"Jim","IT","FL"}}), QueriedRecord = Record.RemoveFields(Source{0},{"Region"}) in QueriedRecord |
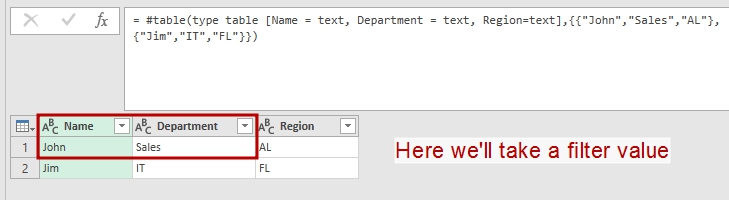
We’ll take a record from this table
The result of above query is a record with two fields:
[Name = "John", Department = "Sales"] .
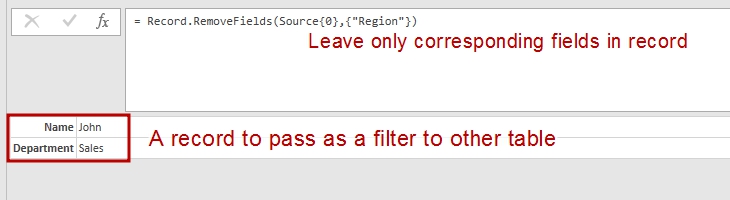
I leaved only needed fileds in this record
Then we pass it as an filter argument to other table:
|
|
let Source = #table(type table [Name = text, Department = text, Date = text],{{"John","Sales","01.01.16"},{"Jim","IT","02.01.16"}}), ChType = Table.TransformColumnTypes(Source,{{"Date", type date}}), Filtered = try ChType{QueryRecord} otherwise null in Filtered |
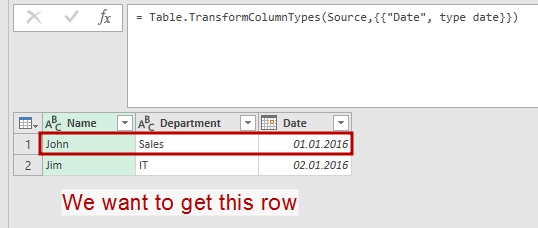
We will filter this table with the result of previous query
The result is a desired record:
|
|
[Name = "John", Department = "Sales", Date = "01.01.2016"] |
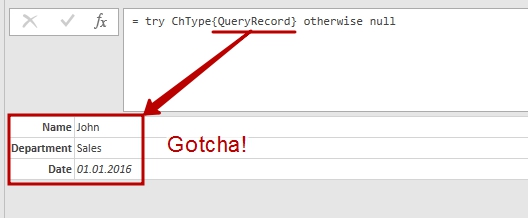
Hey-ho, it works!!!
Another one “Get parameter” function
And a cherry on the cake – quick parameter selection function. You can easy change it for your needs:
|
|
(param_table as table, param_name as text) => let fnParam = try param_table{[param=param_name]}[value] otherwise null in fnParam |
You can also find a complete description of item selection in “Microsoft Power Query for Excel Formula Language Specification” (see “6.4.1 Item Access” on page 59 in August 2015 edition).
Follow me:
After @datachant have posted on using List.Accumulate in Power Query, I was intrigued of practical implementations of this function.
As you can see from his post, List.Accumulate takes a list as an input parameter, and then, starting from initial seed value, invokes the same accumulator function on each element of list, consequently.
You just need to remember than List.Accumulate can use two parameters in accumulator function, state and current: state (i.e. current result of previous calculations) of accumulator and a current element from given list. Final result will be a value that we got on the last iteration of accumulator function. Please note that seed value actually used as the first state value in accumulator.
The power of List.Accumulate is in iterations: we will execute accumulator function as many times as the number of elements in list. So, if we have an algorithm that needed repeating calculations on list members or as much times as list members count, List.Accumulate is the answer.
I found a small algorithm that shows a practical use and core concepts of List.Accumulate: conversion from binary number to decimal. In this algorithm bits of the binary number are used one by one, starting with the most significant (leftmost) bit. Beginning with the value 0, you need to repeatedly double the prior value and add the next bit to produce the next value.
So, if we would like to convert binary 11012 to decimal number 1310, we need to split binary number to the list of bits:
{1,1,0,1}
Then we take seed value of 0 and perform next operations: double the prior value and add the next bit, repeat while we have bits:
0 (seed, or first state) *2 + 1(current bit) = 1
1 (state) * 2 + 1(current bit) = 3
3(state) * 2 + 0(current bit) = 6
6(state) * 2 + 1(current bit) = 13
In this algorithm we can see all parameters for List.Accumulate: given list of bits from binary code, initial seed value of 0, state of accumulation transferred from the one step to the next step, and current element of a list (current bit).
To implement this algorithm in Power Query List.Accumulate we just need to get a list from given input, for example it is a text string: “101010”
|
|
BitList = Text.ToList("101010") // here we’ll get a list of text symbols, // so at the next step we need to implement type transformation // on list elements to be able to do calculations Bin2Dec = List.Accumulate(BitList, 0, (state, current)=> state*2 + Number.From(current)) |
The result could be nothing than 42, it’s quite universal 🙂
I hope that this example will help you to find more practical implementations of List.Accumulate. And if you remember that initial list could be used just as iterations counter, and a seed value could be any… to be continued.
Follow me:
There are plenty examples on how to unpivot nested tables (some brilliant ones can be found here and here). But what if a table we need to make flat has no nested headers for repeating groups of columns? It ought to be nested, but it doesn’t. And standard unpivoting methods then do not works then.
Stacking (or unpivoting) non-nested groups of columns is not a common task, but sometimes it appears. It could be due to bad constructed software report or hand-made user table in Excel or web-page scrapping. But in some case, we meet with this horror.
Once a client asked me to help with intelligence on his database. Of course, I agreed. But when I saw this “database” which he proudly presented to me, I was glad that the customer does not see my face and did not hear any comments passed my lips.
There was an Excel worksheet with more than 100 (one hundred) columns with more than 10000 rows, with all diversity of data in it. About 80 columns was in repeating groups, named “Date”, “Sum”, “Date”, “Sum” …. “Date”, “Sum” – without nesting or grouping.
For some reasons, when a VBA solution couldn’t be applied (especially if you work in Power BI and want to pull data in it without voodoo dances), the only way to flatten this table was using the Power Query for Excel 2010-2013 (or “Get Data” in Power BI, “Get & Transform” in Excel 2016).
Working on that task I discovered that there are at least four ways of doing it. You can choose the method that best suits your case.
As-is and to-be
What we have in source and what we need to get shown on the picture below:
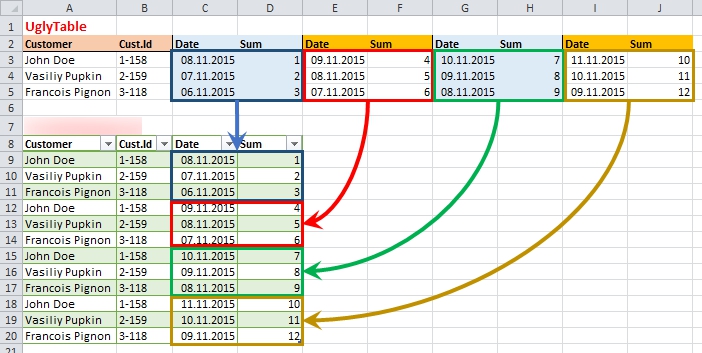
The source and the target: not so easy…
Actually we need to stack repeating groups one under other, keeping in place the common data from first columns.
Continue Reading →
Follow me:
In my previous post I described how to pull a single value from one column and apply it as a new column’s value for specified rows. This kind of transformation could be applied when we have a mixed data source: one part of data is in a tabular form, and other part of data forms headers for these tables.
Now there is more complex task: we have a several values in separate rows, which (being taken together) form unique header for each data table. And the question is how to transform this header into new columns for tabular parts.
What we need to do is best illustrated by the picture:
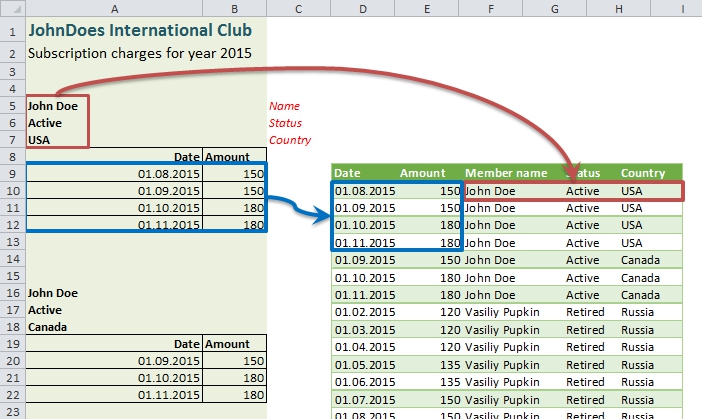
What we have to do: attach title fields to data rows.
Continue Reading →
Follow me:
In my work I often meet data sources with a mix of tabular data and other useful info outside the tables. Usually it comes from some web reports or accounting programs output, where applied report criteria or other important data forms a header rows of report. While it is not so hard to make-up this data in Excel, it is better to avoid hand-made rinsing and washing every time we got a raw source updates. This becomes even more relevant when working with Power BI, where we don’t want or cannot make data preparation in Excel.
So here comes the cavalry Power Query with its outstanding abilities of raw data transformation.
(I really don’t sure how I should name this post)
The short preamble (“A long time ago…”)
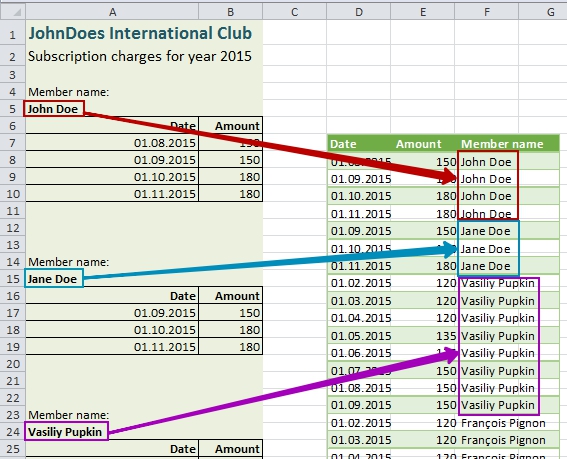
You can imagine (and this is true!) that in almost every culture exists John Doe. Somehow these guys decide to unite and form a “JohnDoes International Club”. We do not know, what aims and goals of this club is (hope it is not “rule the world”), but anyway, this club exists with all necessary bureaucracy.
Every month club members have to pay membership charges. And every month club cashier got a report on charges collection.
The case
In this report we can see a standard header of what this document is about, and then information on each member’s charges. Each club member has own “table of charges” in this report, and each table precedes with two rows: pointer “Member name” and a member’ name itself.
In a sample report we can see four names: John Doe and Jane Doe form the USA, Vasiliy Pupkin from Russia and Francois Pignon from France (my apologies to monsieur Francois Dupont, but for me monsieur Pignon is already №1 due to beautiful comedies with Pierre Richard). Also please note that any coincidences to real people and clubs are accidental.
What we have to do is to make a flat table from the report:
Transfer values to a new column: things to do
Continue Reading →
Follow me: